Chart
The Chart widget is a powerful visual tool for presenting data in a clear and engaging way by breaking information into proportional segments that represent percentages of a whole. It helps visitors quickly understand statistics, comparisons, or performance metrics at a glance without needing to read large amounts of text. By turning complex numbers into simple visual elements, charts improve clarity, support storytelling through data, and enhance the overall visual appeal of your content.
Chart Options
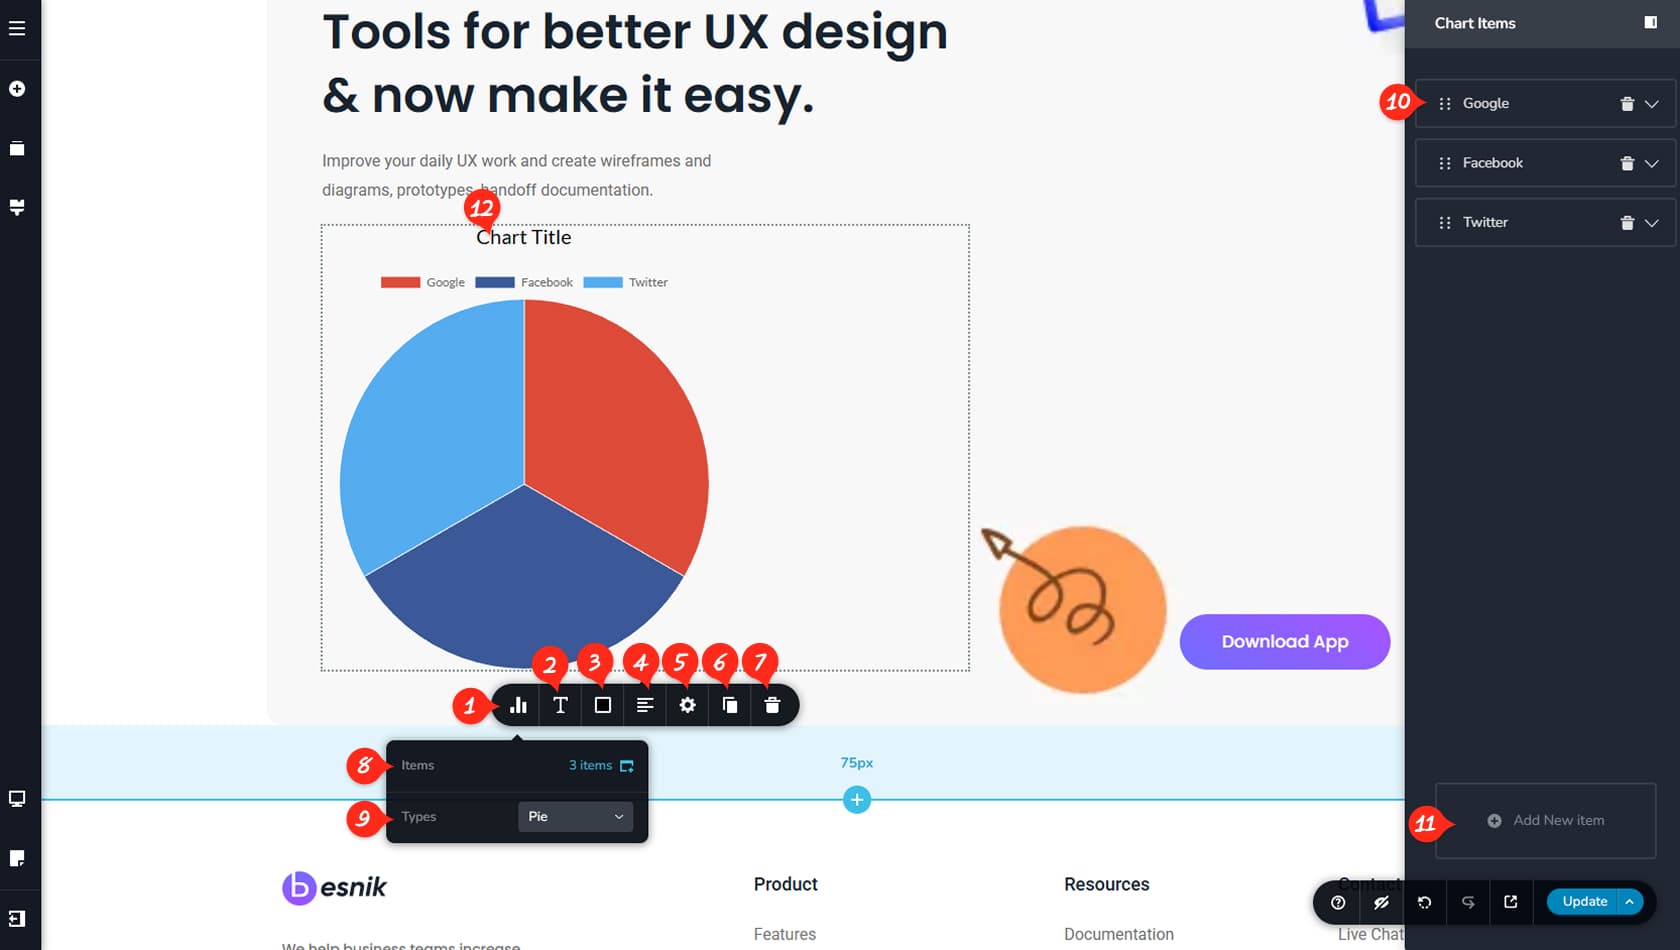
Chart Options Panel
After dragging and dropping the Chart widget, click it to open the toolbar. Select the first icon on the left to access the widget’s options panel.
Items Typography
Here you can adjust the typography of the item names. In the example above, this controls the typography for labels such as Google, Facebook, and Twitter.
Border Colors
This setting allows you to customize the chart’s border colors.
Chart Alignment
Here you can define the alignment of the chart.
Chart Width and Styling
This option lets you adjust the chart width and open the Styling and Effects panels to manage paddings, margins, animations, and more.
When referring to the Styling Panel of the widget, please see the Widgets Styling article for more details and an in-depth guide. Note that most widgets share similar styling options, with slight variations depending on the specific widget.
Duplicate Chart
This control duplicates the Chart widget.
Delete Chart
This control deletes the Chart widget.
Chart Items List
Here you can open the right-side panel, which contains controls for the chart’s compared items.
Chart Type
This setting allows you to choose the chart style, including Pie chart, Bar chart, or Line chart. Each style includes additional options, such as date labels for line and bar charts, and a Fill option available for line charts.
Chart Items Panel
The right-side panel manages the chart items. More details are provided in the Chart Items section below.
Add Chart Item
Here you can add new items to your chart. Additional editing details are explained below.
Chart Title
To rename the chart, simply click the title and edit the text. You can also adjust its typography, colors, and alignment.
Chart Items
Reorder Chart Items
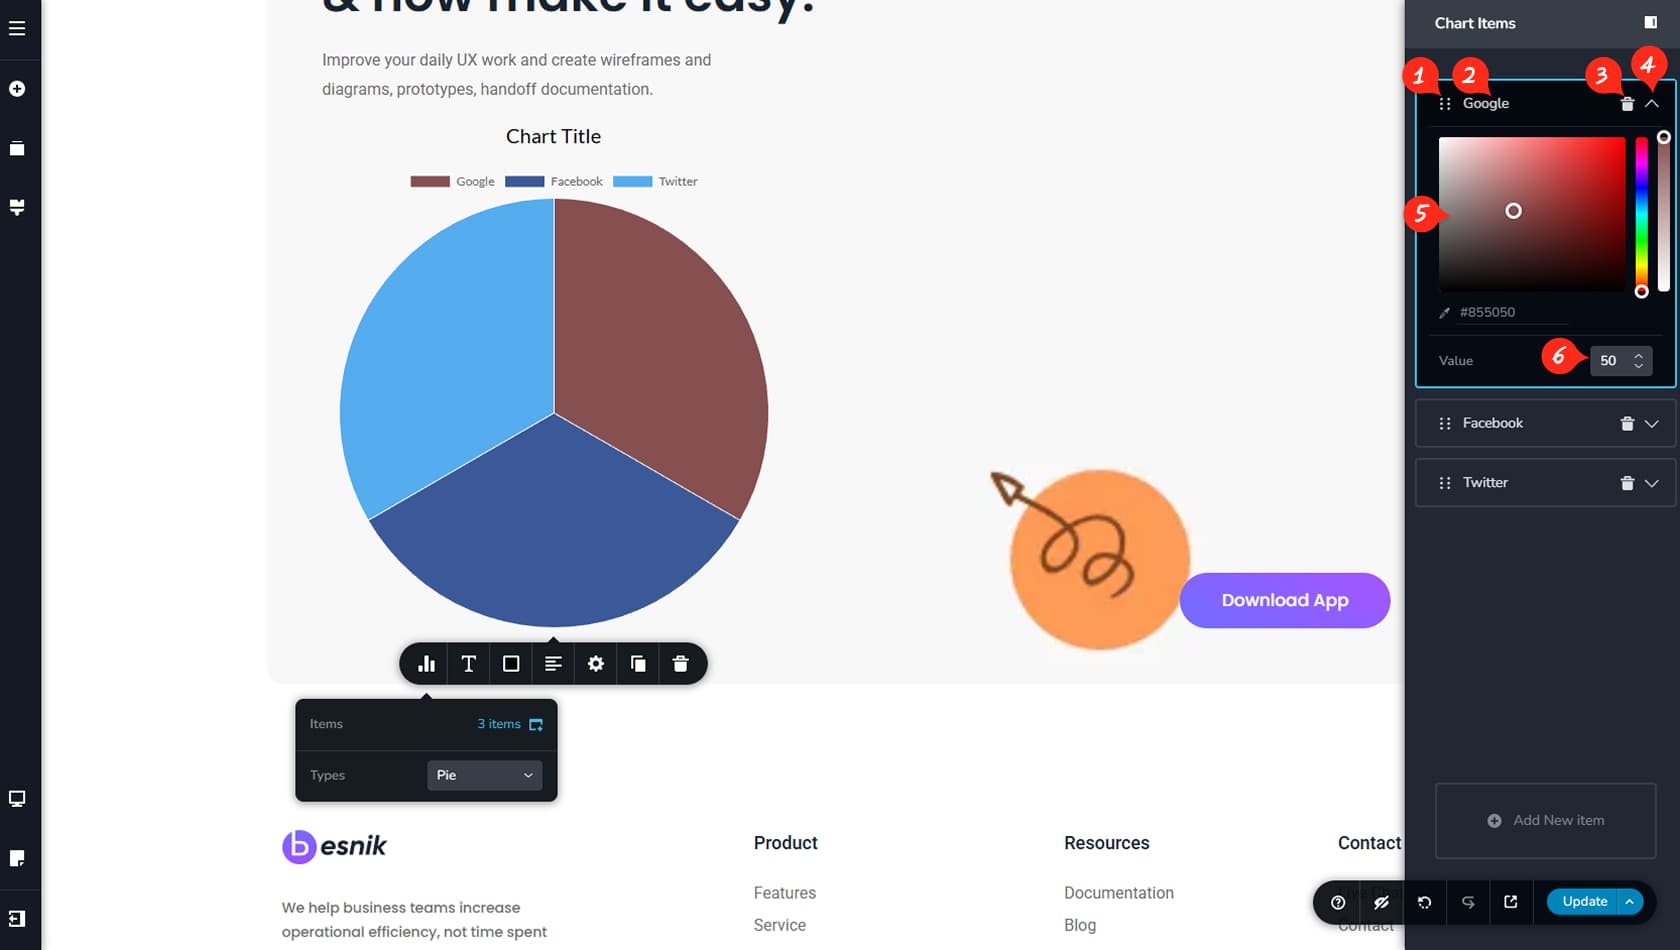
From here you can drag and drop chart items to reorder them.
Chart Item Title
From here you can edit the title of the chart item.
Delete Chart Item
From here you can delete the chart item.
Chart Item Panel
From here you can open the colors and value panel below.
Chart Item Color
From here you can change the color of the item inside the chart.
Chart Item Value
From here you can set the value inside the chart.